Working Example
Last updated on 2026-04-28 | Edit this page
Overview
Questions
- What does a machine learning solution look like?
- How can I solve a problem with machine learning in Python?
Objectives
- Understand the typical structure of an ML project
- Run a worked example
- Start to think about what your own solution may look like
Time to Dive Right In
We’re going to jump straight into the deep end by running a worked example you’ve already prepared in the summary and setup section. Don’t be intimidated if you don’t understand everything right away, that’s perfectly okay. This is just a high-level pass to give you context and a feel for the overall process. Throughout the week, each session will break down these steps in more detail so you’ll build a deeper understanding as we go.
Note: For transparency, all scenarios presented in these lessons are entirely fictional and are not intended to be accurate or representative of real-world facts.
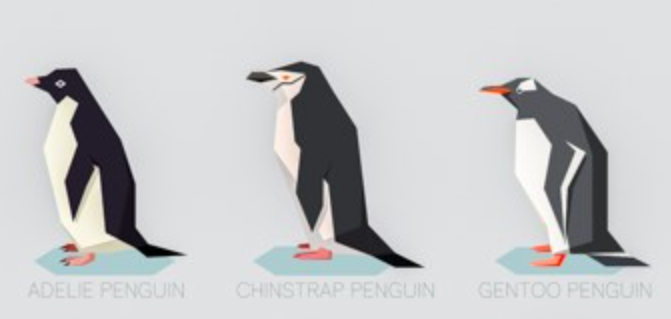
Scenario: Pick a Penguin 🐧
A team of marine biologists working in Antarctica is keen to identify penguin species, as the balance between these species is a critical indicator of climate change and the overall health of marine ecosystems. However, capturing penguins to determine their species is both costly and disruptive to the wildlife.
To reduce costs and disturbance, they are investigating whether remote camera stations equipped with automated detection algorithms could track and log colonies of penguins without physical handling. As a first step, they want to assess how reliably species can be classified based on observable features.
They have already assembled a dataset containing individual penguins with known species labels, along with associated characteristics such as the island they were found on, bill length and depth, flipper length, body mass, and sex.
UK Antarctic Heritage Trust, ukaht.org
Based on this dataset, they want to explore the following question:
Your task
We’ll use this scenario to walk through the typical stages of a machine learning project. Now that we’ve established the problem definition, the next steps on our journey are: - Import the data: Get our tabular penguin data into our environment. - Data exploration: Examine the dataset to understand what it contains and identify any missing or unusual values. - Preprocessing: Clean and prepare the data so that it can be used in a machine learning model. - Model selection: Choose an appropriate algorithm to predict species based on the available features. - Training and testing: Split the data to fairly evaluate model performance. - Evaluation: Assess how accurately your model predicts species and investigate which features are most important.
Setup
OUTPUT
ModuleNotFoundError: No module named 'pandas'OUTPUT
ModuleNotFoundError: No module named 'matplotlib'Import the data
OUTPUT
NameError: name 'pd' is not definedInspect the data
OUTPUT
NameError: name 'df_peng' is not definedOUTPUT
NameError: name 'df_peng' is not definedPYTHON
# Which features can we insepect the distribtuion?
features = ['bill_length_mm', 'bill_depth_mm', 'flipper_length_mm', 'body_mass_g']

plt.figure(figsize=(12, 8))
OUTPUT
NameError: name 'plt' is not definedPYTHON
# enumerate gives us a numeric value as well as our feature during our loop
for i, feature in enumerate(features, 1): #starting from 1 in our numeric loop
    plt.subplot(2, 2, i) # plot position
    df_peng[feature].hist(bins=10) #create a histogram from our feature with 10 bins
    # add axis labels
    plt.xlabel(feature)
    plt.ylabel('Count')
OUTPUT
NameError: name 'plt' is not definedOUTPUT
NameError: name 'plt' is not definedOUTPUT
NameError: name 'plt' is not defined